Support for LAist comes from
Local and national news, NPR, things to do, food recommendations and guides to Los Angeles, Orange County and the Inland Empire
Stay Connected
Listen
🗳️ Voter Game Plan: We're here to help you make sense of your ballot

Southern California Public Radio Diversity Report (2022)

In 2020, Southern California Public Radio formed an independent task force to assess the organization in terms of diversity, equity, and inclusion, and to make a set of recommendations to the executive team and board of trustees.

More than 90 percent of staff engaged with the task force, as did former employees, board members, Regional Advisory Council members, and independent DEI consultants. In March 2021, the task force produced its final report, including a set of 44 specific recommendations for advancing a diverse, equitable, and inclusive culture across SCPR. Based on those recommendations, the executive team developed an implementation plan that includes producing and publishing an annual staff demographics survey.

At SCPR, we believe that diversity, equity, and inclusion—in everything we do—are critical to our success. Our commitment to our ongoing DEI implementation plan is a reflection of that.

Our survey was conducted in December 2021. The results are based on how 149 of 169 active employees self-reported. Due to rounding or unavailable data, the values do not always sum to 100 percent. The charts reflect answers from all respondents, except where otherwise noted. This data was collected as part of an optional survey for all staff. It is separate from the data used by Human Resources; that data is more limited and is collected at the time of an employee’s application to work here. Here are the results of our December 2021 self-reported staff demographic survey.

Race and Ethnicity

  • 53% of SCPR employees identify with a race or ethnicity other than white alone, which is reflected in the chart below. 
  • 43% of supervisors identify with a race or ethnicity other than white alone. 
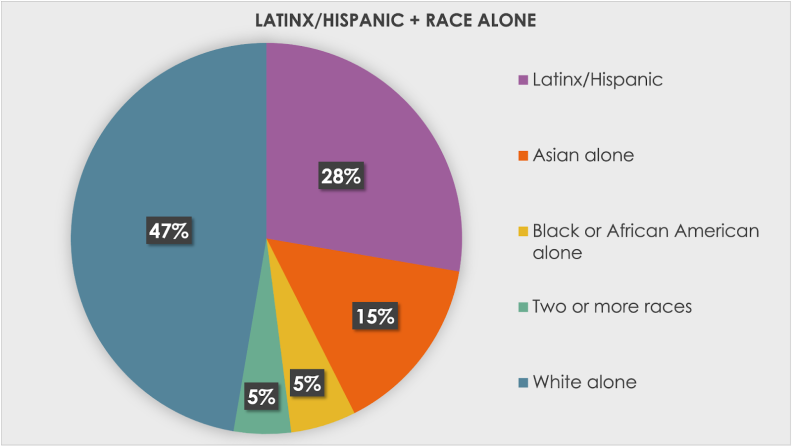
A pie chart that shows demographic data at SCPR. It shows 47% as white, 28% as Latinx/Hispanic, 15% as Asian alone, 5% as Black or African American alone, and 5% as two or more races.
Note: Latinx/Hispanic includes respondents of any race. Other categories are non-Latinx/Hispanic. This chart may omit a very small number of responses from a small group whose information wasn't able to be reflected in a chart.
()

The following chart compares the Latinx/Hispanic + race makeup of Southern California Public Radio with that of Los Angeles County.

A horizontal bar chart that shows SCPR demographic data compared to L.A. County data. Latinx/Hispanic is 28% of SCPR compared to 48% of L.A. County. White alone is 47% of SCPR compared to 26% of L.A. County. Black or African American alone is 5% of SCPR compared to 8% of L.A. County. American Indian and Alaska Native alone is 0% of SCPR compared to <1% of L.A. County. Asian alone is 15% of SCPR compared to 15% of L.A. County. Two or more races are 5% of SCPR compared to 3% of L.A. County.
Note: L.A. County figures come from the U.S. Census Bureau’s 2020 Decennial Redistricting data.
()

  • When we look at race alone, without factoring in Hispanic-Latinx identity, 43% of SCPR employees identify with a race other than white alone.
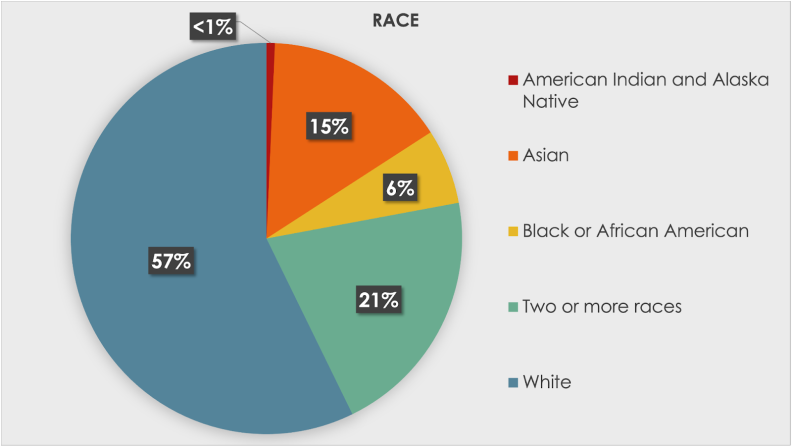
A pie chart that looks at race alone at SCPR. It shows that 57% is white, 24% is two or more races, 15% is Asian, 6% is Black or African American, and <1% is American Indian and Alaska Native.
Note: This chart omits four people who declined to answer the question on race. Staff who identify as Latinx-Hispanic are included in each category.
()

  • A note on staff who identify as more than one race: The survey provided staff with two different opportunities to indicate whether they identify as biracial or multi-racial. One question asked directly: “Do you consider yourself to be biracial or multi-racial?” Separately, the question on race included the dropdown choice “Two or more races.” Answers were not always consistent between the two questions. When accounting for all staff who either answered “yes” to the multi-racial question or selected “Two or more races” for the race question — or both — the total percentage who identify as biracial or multi-racial rises to 23%.

Nearly three-quarters of staff have been hired within the last 10 years—more than half in the last five years.
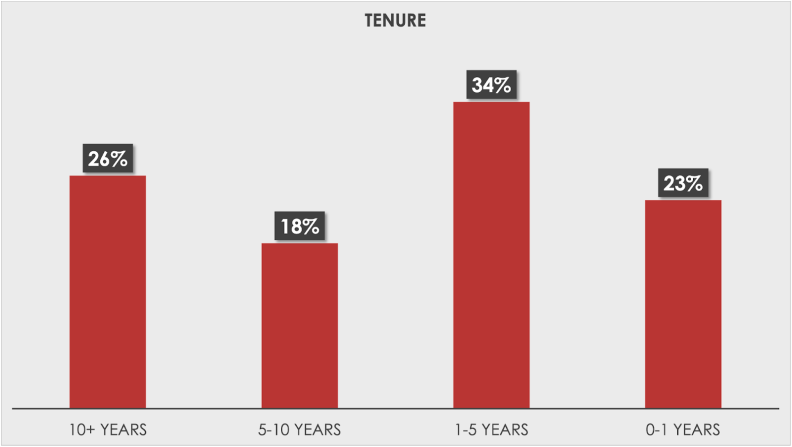
A bar chart with tenure percentages. It shows 26% have worked here for 10+ years, 18% between 5-10 years, 34% between 1-5 years, and 23% between 0-1 years.
Note: One person who worked on and off for the company beginning 2013 was coded as “5-10 Years.”
()

The racial and ethnic diversity of staff has also increased over the past 10 years.

A bar graph that compares tenure with Latinx/Hispanic and race alone. White alone makes up more than half of employees at the company for more than 10 years. In other races and ethnicities, the proportions increase in staff hired in more recent years.
Note: “Latinx/Hispanic includes respondents of any race. Other categories are non-Latinx/Hispanic. This chart may omit a very small number of responses from a small group whose information wasn't able to be reflected in a chart.
()

Gender and Sexuality

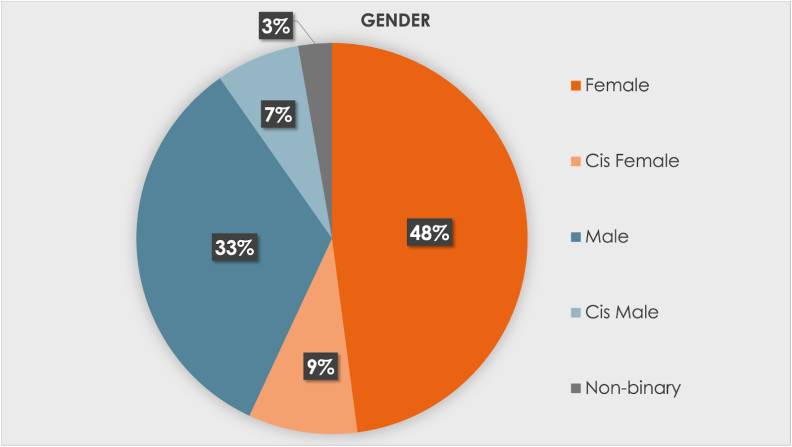
A pie chart of the gender at SCPR. It shows 48% as female, 33% as male, 9% as cis female, 7% as cis male, and 3% as non-binary.
Note: Results were coded to group similar responses. Cis/woman was coded as cis female; cis man as cis male; gay male/man as male; gay female/woman as female; man as male; woman as female; she/her as female; he/him as male. If someone listed their gender as heterosexual but pronouns as she/her, they would be coded as female. Cisgender/heterosexual answers were coded depending on the pronouns provided. A small number of people declined to self-identify their gender. Others who did not provide a response to the gender question and listed their sexual orientation as “male,” were coded as “male,” accordingly.
()
A pie chart for pronoun usage at SCPR. It shows 56% as using she/her, 38% as using he/him, 2% as using she/they, 1% as using they/them, 1% as using he/they, 1% as having no preference, and 1% who prefer name only.
Note: The response she/ella was coded as she/her. Two people declined to answer. One other person who declined to answer listed their gender as “female, she/her” and was coded “she/her,” accordingly.
()

  • 62% of staff use pronouns other than he/him.
  • The same percentage of supervisors use pronouns other than he/him. 
  • 22% of staff who responded to the survey identify as LGBTQ+. 

Thirteen people declined to share their sexual orientation. Responses such as gay, pansexual, queer, fluid, straightish, lesbian, LGBTQ, bisexual, and homosexual were coded as LGBTQ+.

A Closer Look at the Content Division

  • 55% of respondents self-identified as part of the content division. 
  • Within the content division, 53% identify with a race or ethnicity other than white alone. 
  • 42% of supervisors within the content division identify with a race or ethnicity other than white alone.
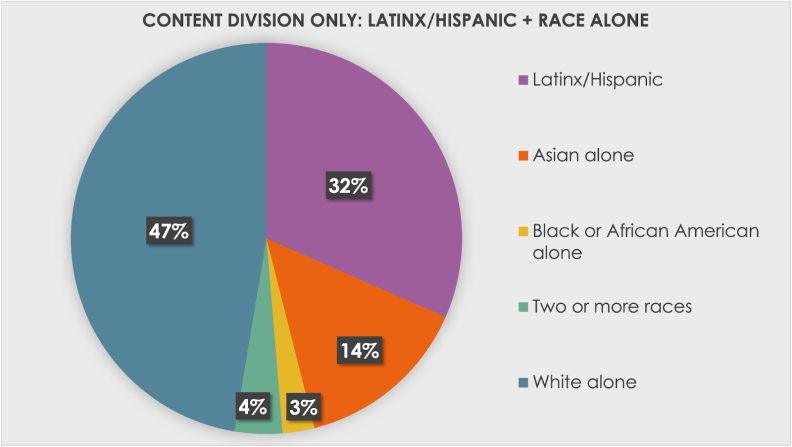
A pie chart that shows Latinx/Hispanic and race alone diversity in the content division only. There are 47% of staff who are white alone, 32% are Latinx/Hispanic, 14% are Asian, 4% are two or more races, and 3% are Black or African American.
Note: “Latinx/Hispanic” includes anyone of any race, while the racial categories exclude people who identify as Latino/a or Hispanic.
()

  • 64% percent of content respondents use pronouns other than he/him. 

One person declined to answer.

  • 23% percent of content respondents identify as LGBTQ+. 

Six people declined to answer.

More About Respondents

A pie chart that shows the size of different departments at SCPR as percentages. Fifty-two percent of staff are in Content (news, shows, podcasts, engagement), 13% are in Development, 11% are in Operations, 7% are in Administrative, 6% are in Underwriting, 3% are in Digital Product, 3% are Interns, 2% are in Events, 1% are Human Resources, and 1% are Marketing.
()
A pie chart of employment status at SCPR. Eighty-six percent of people are full-time, 5% are part-time, 4% are intern or apprentice, 3% are contract-based, 2% are freelance, <1% are on-call.
Note: One person declined to share their employment status.
()